1
Navigate to https://eigo.ai/progress/?screen=stats
2
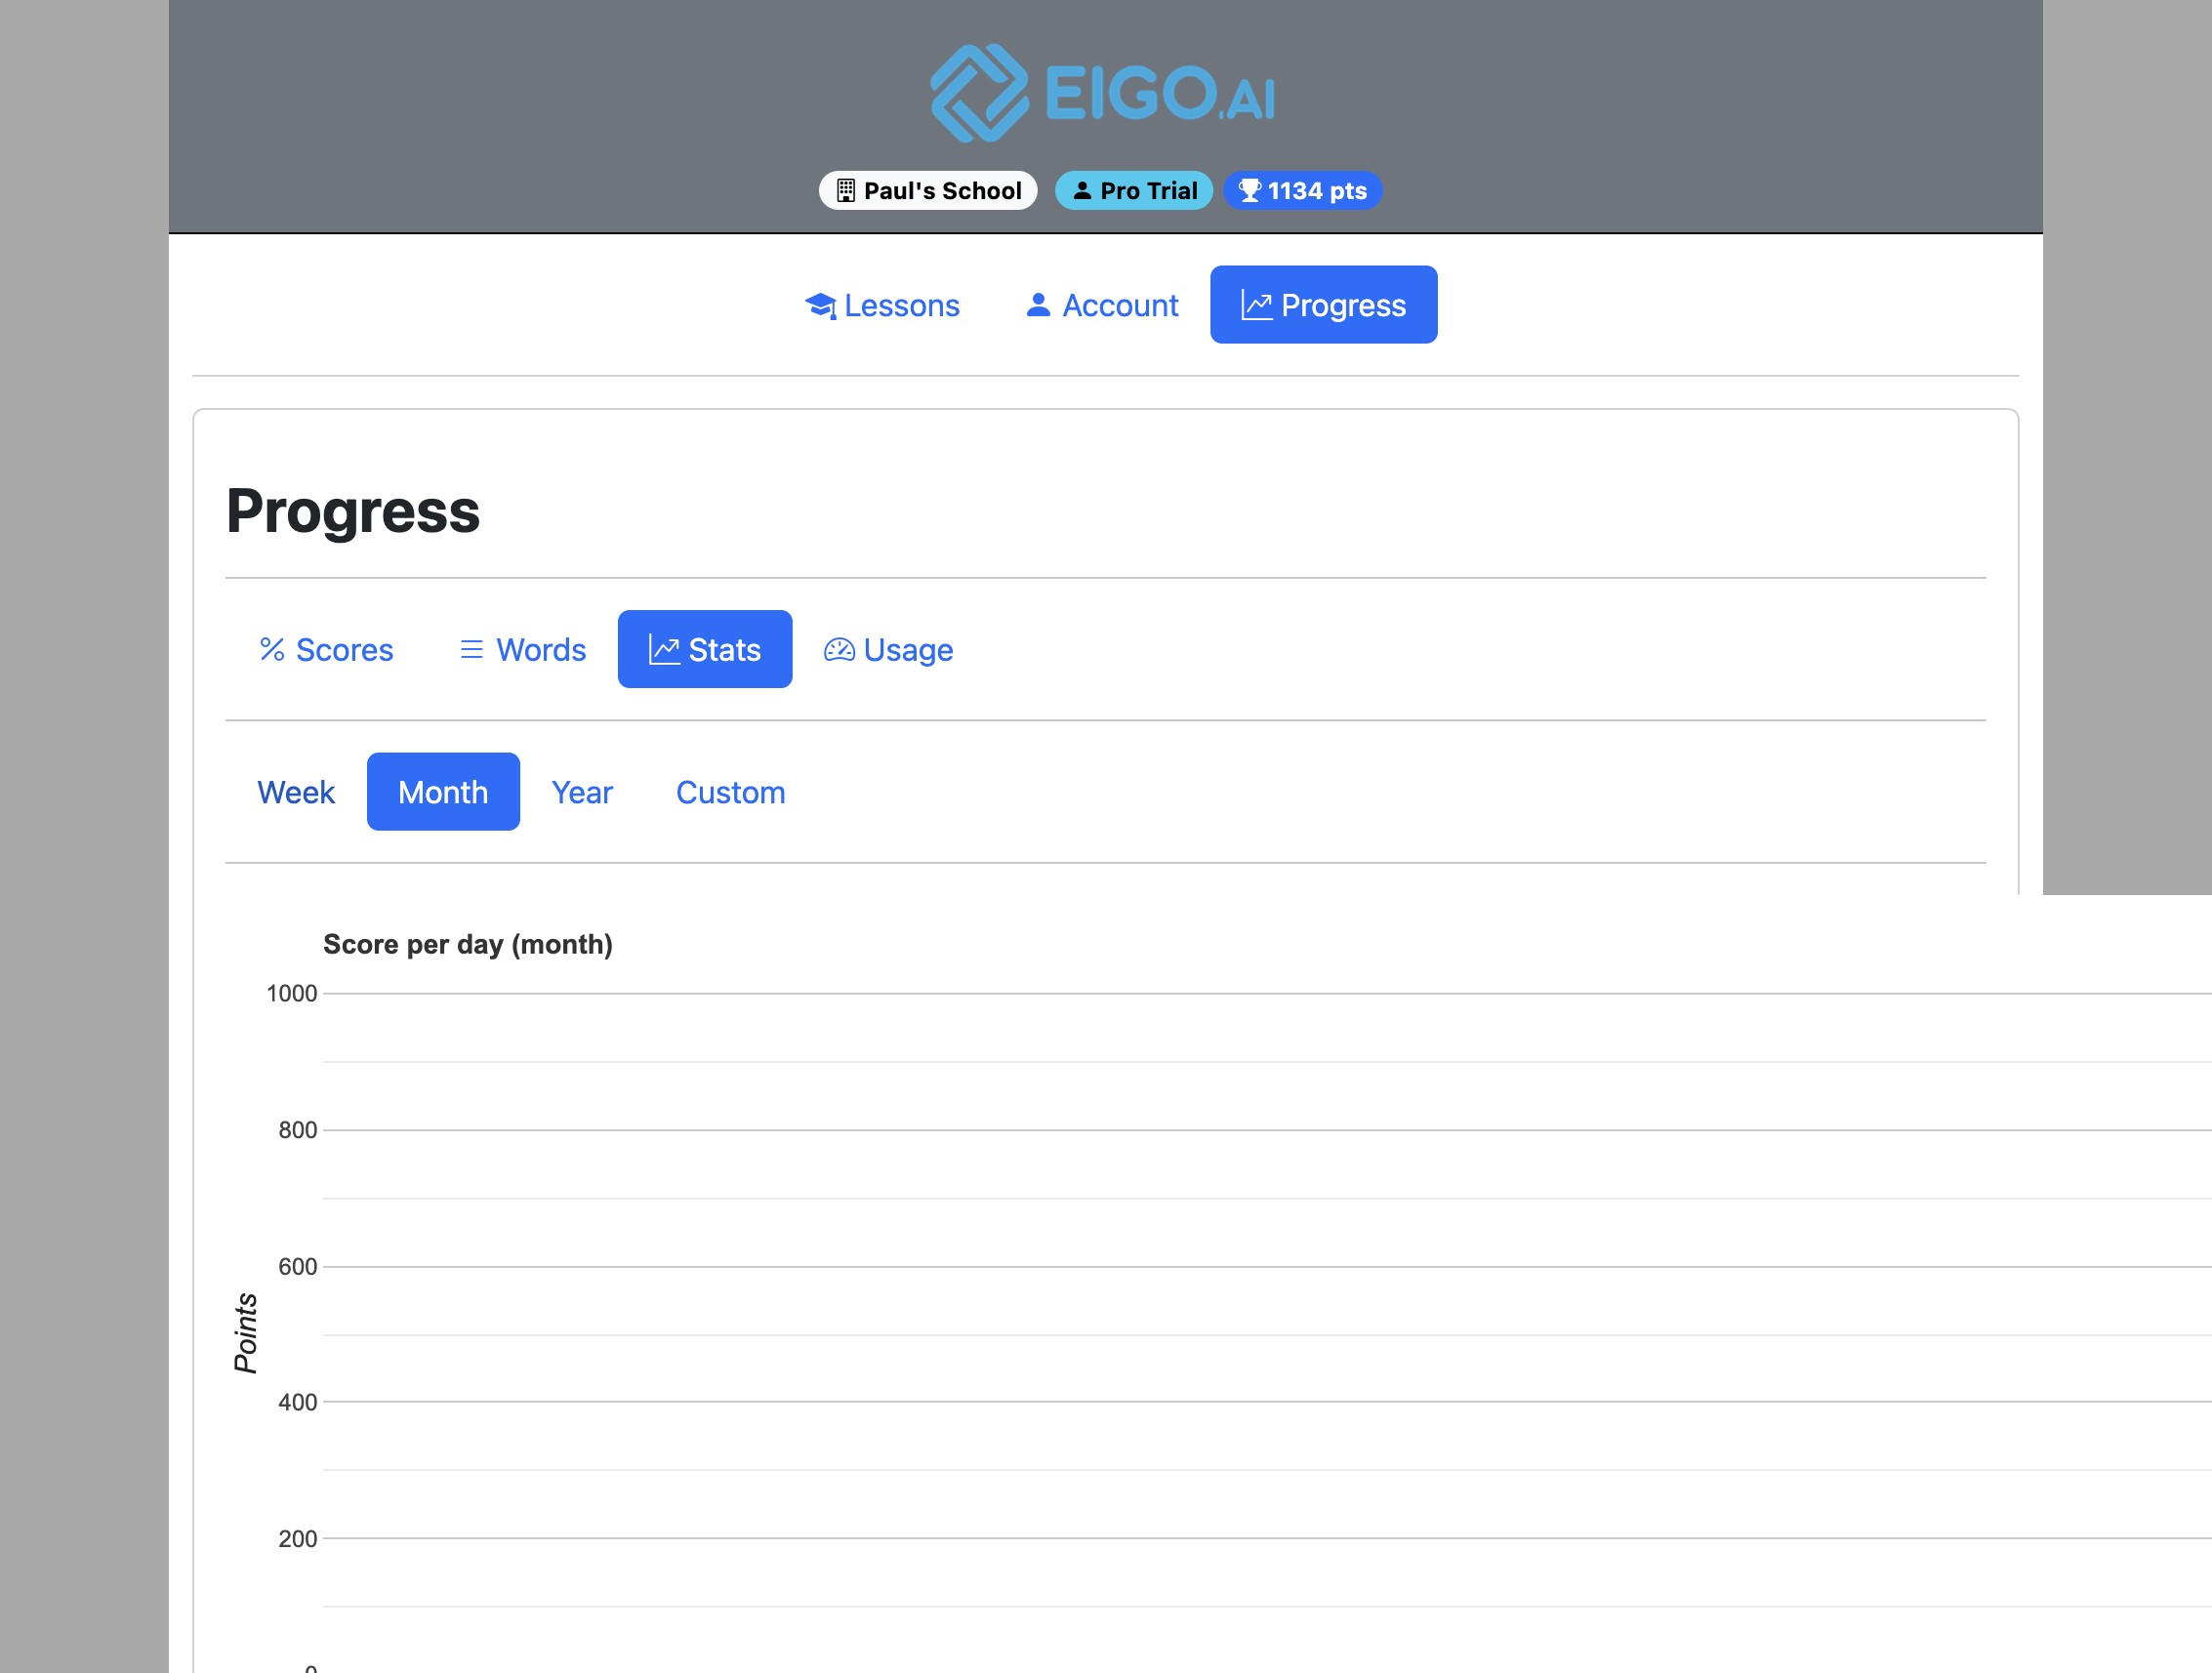
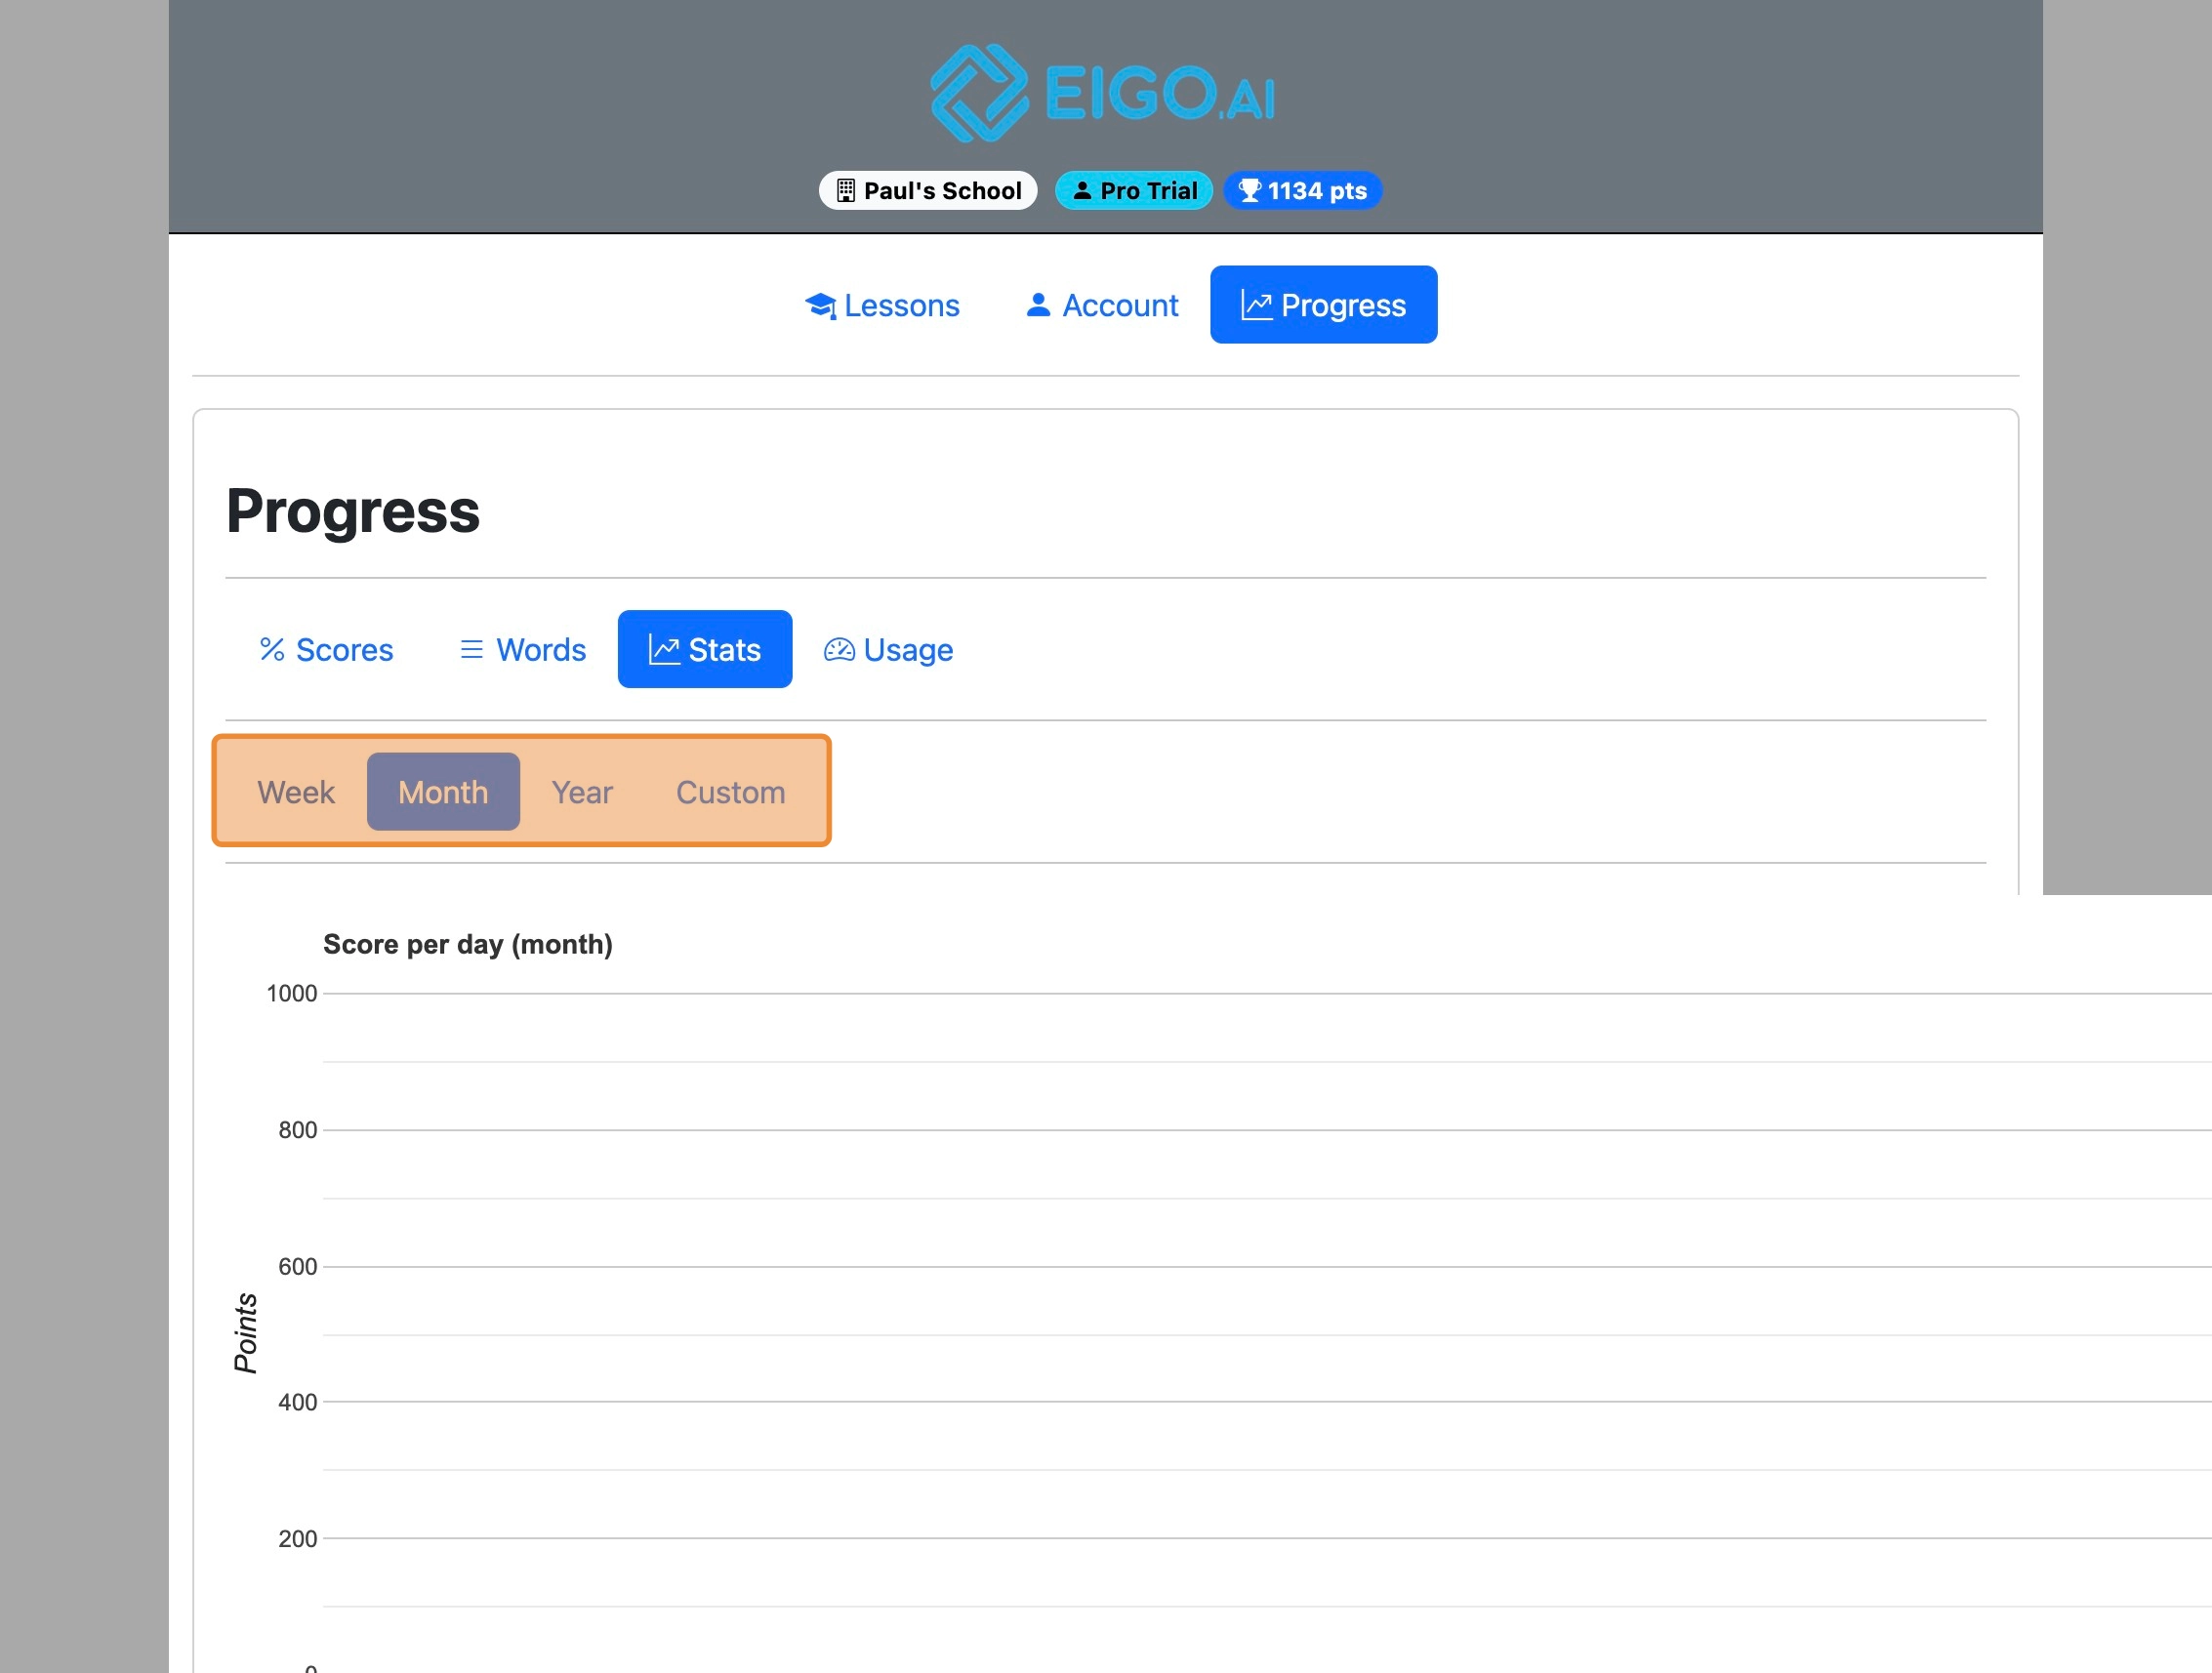
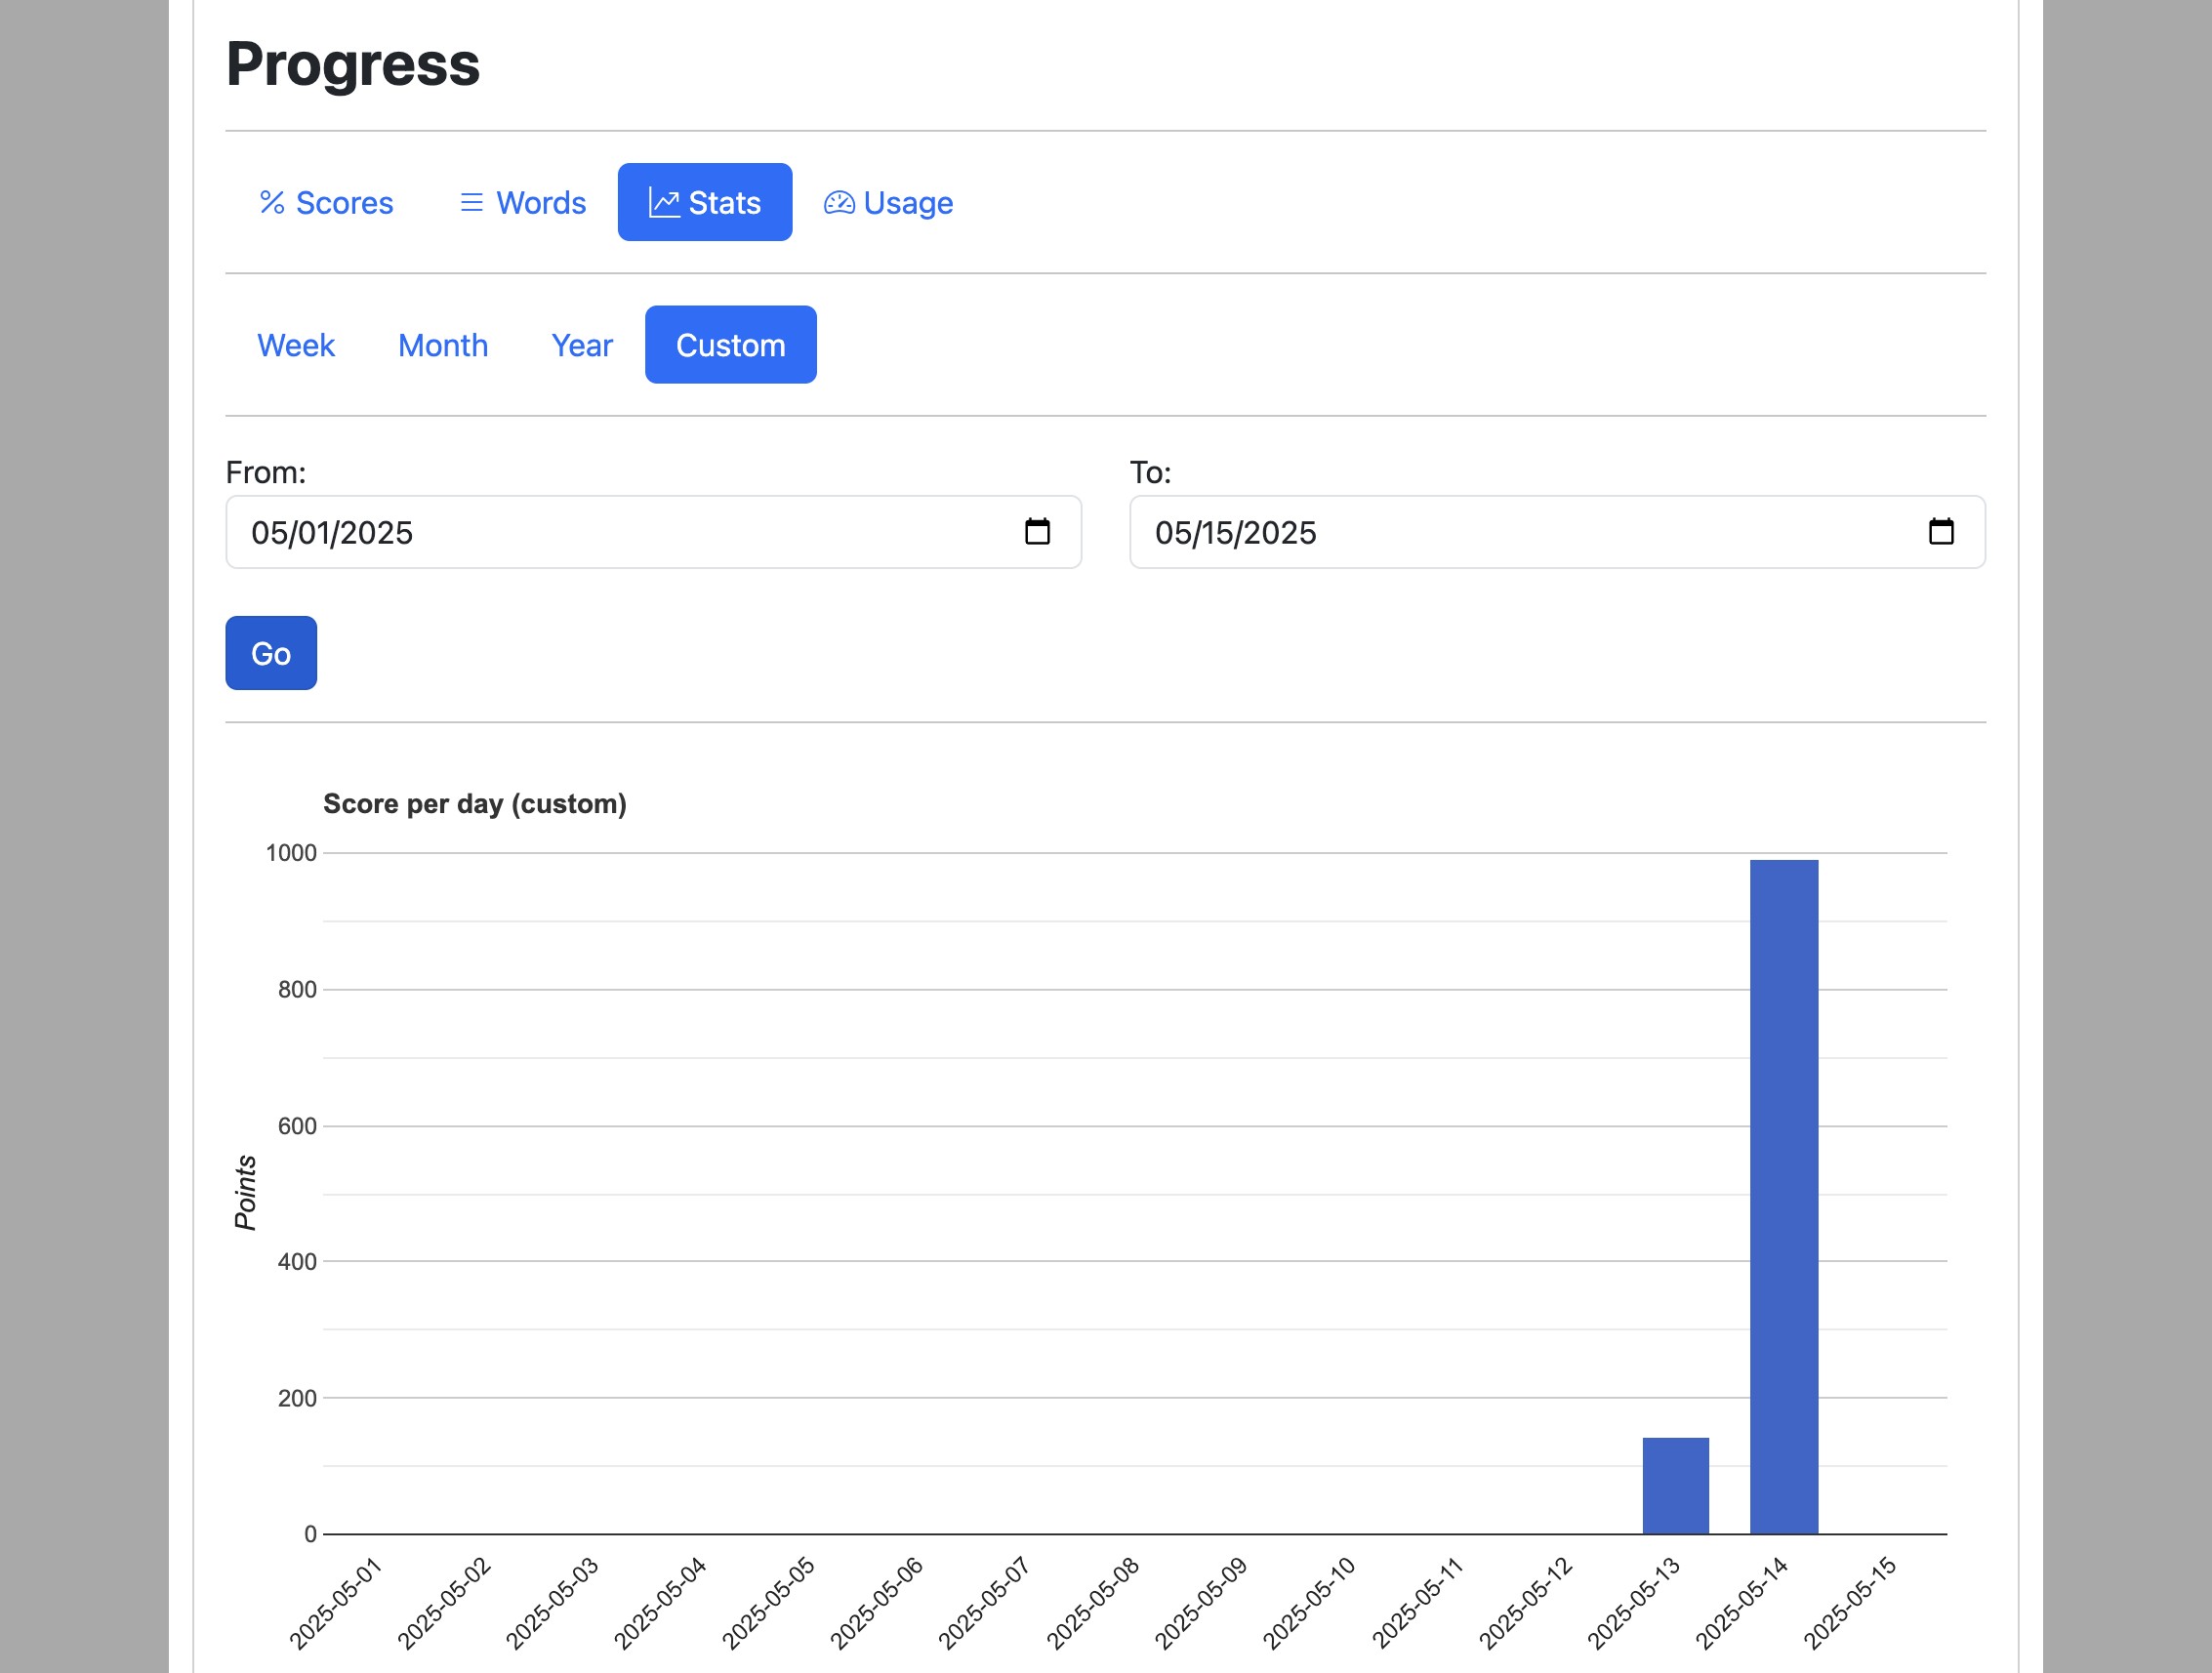
Stats can be viewed by All Time, Week, Month, Year, or Custom range.
3
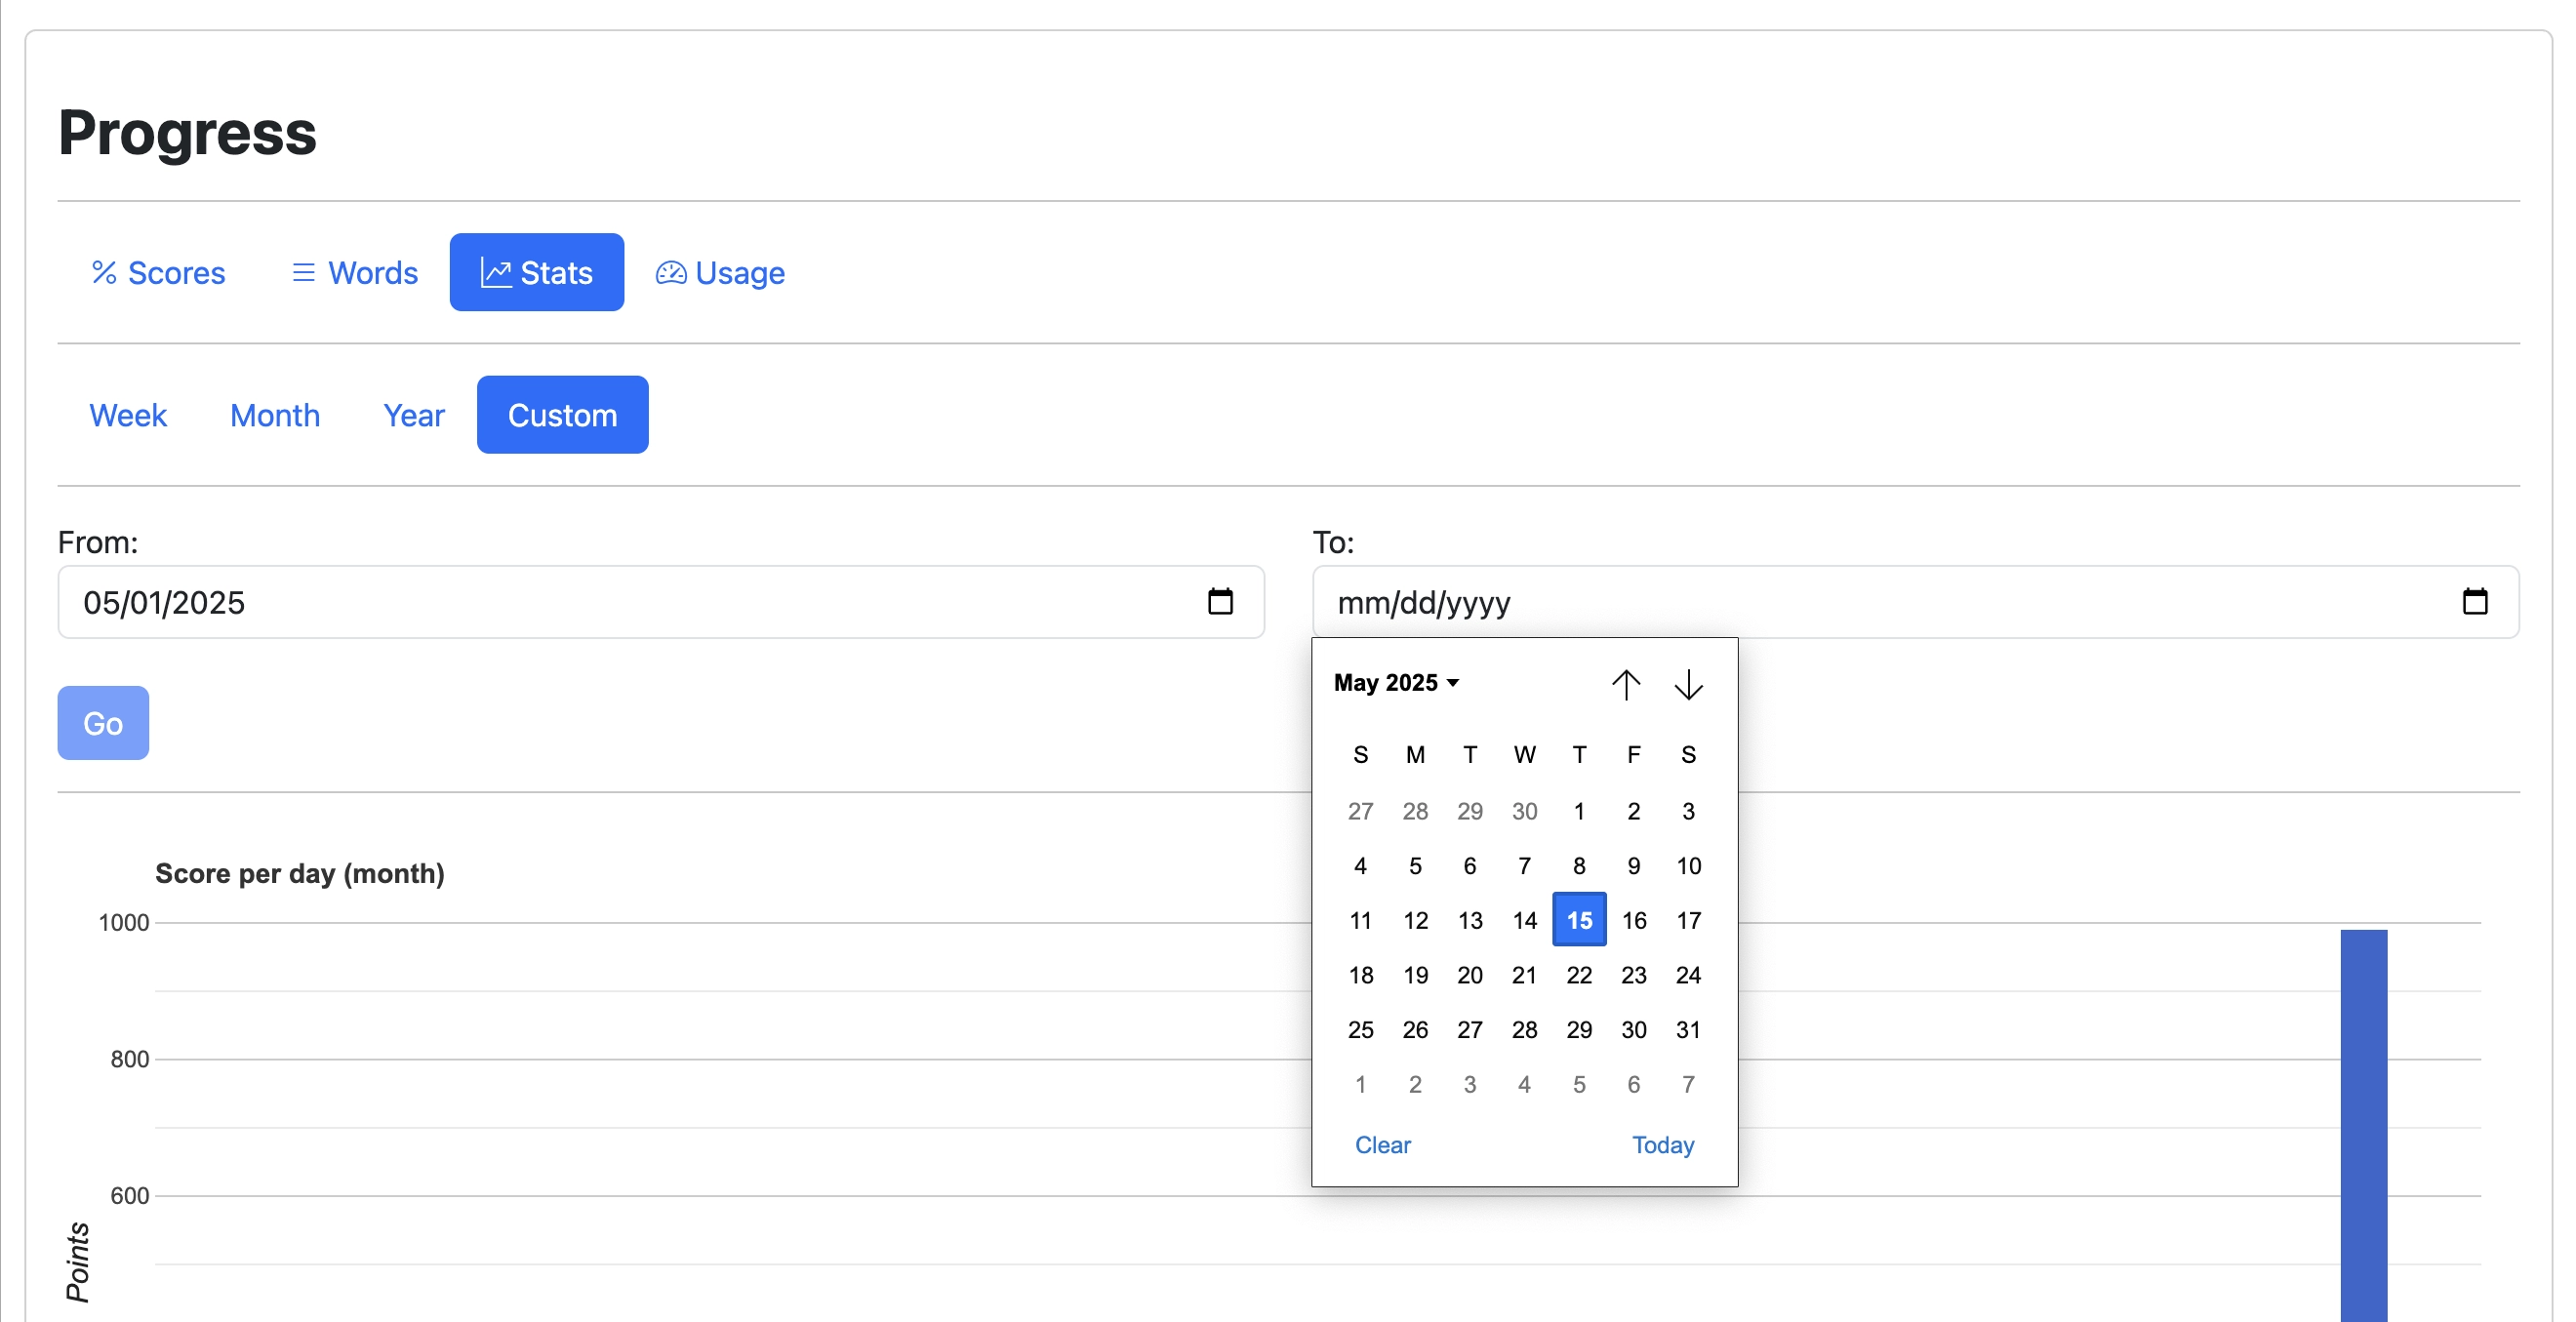
For Custom stats, select the From and To dates using the date fields.
4
Click 'Go' to view stats for the selected custom date range.
5
The 'Score per day' chart shows the combined total score achieved per day, whether in a week, month, year or custom range.
6
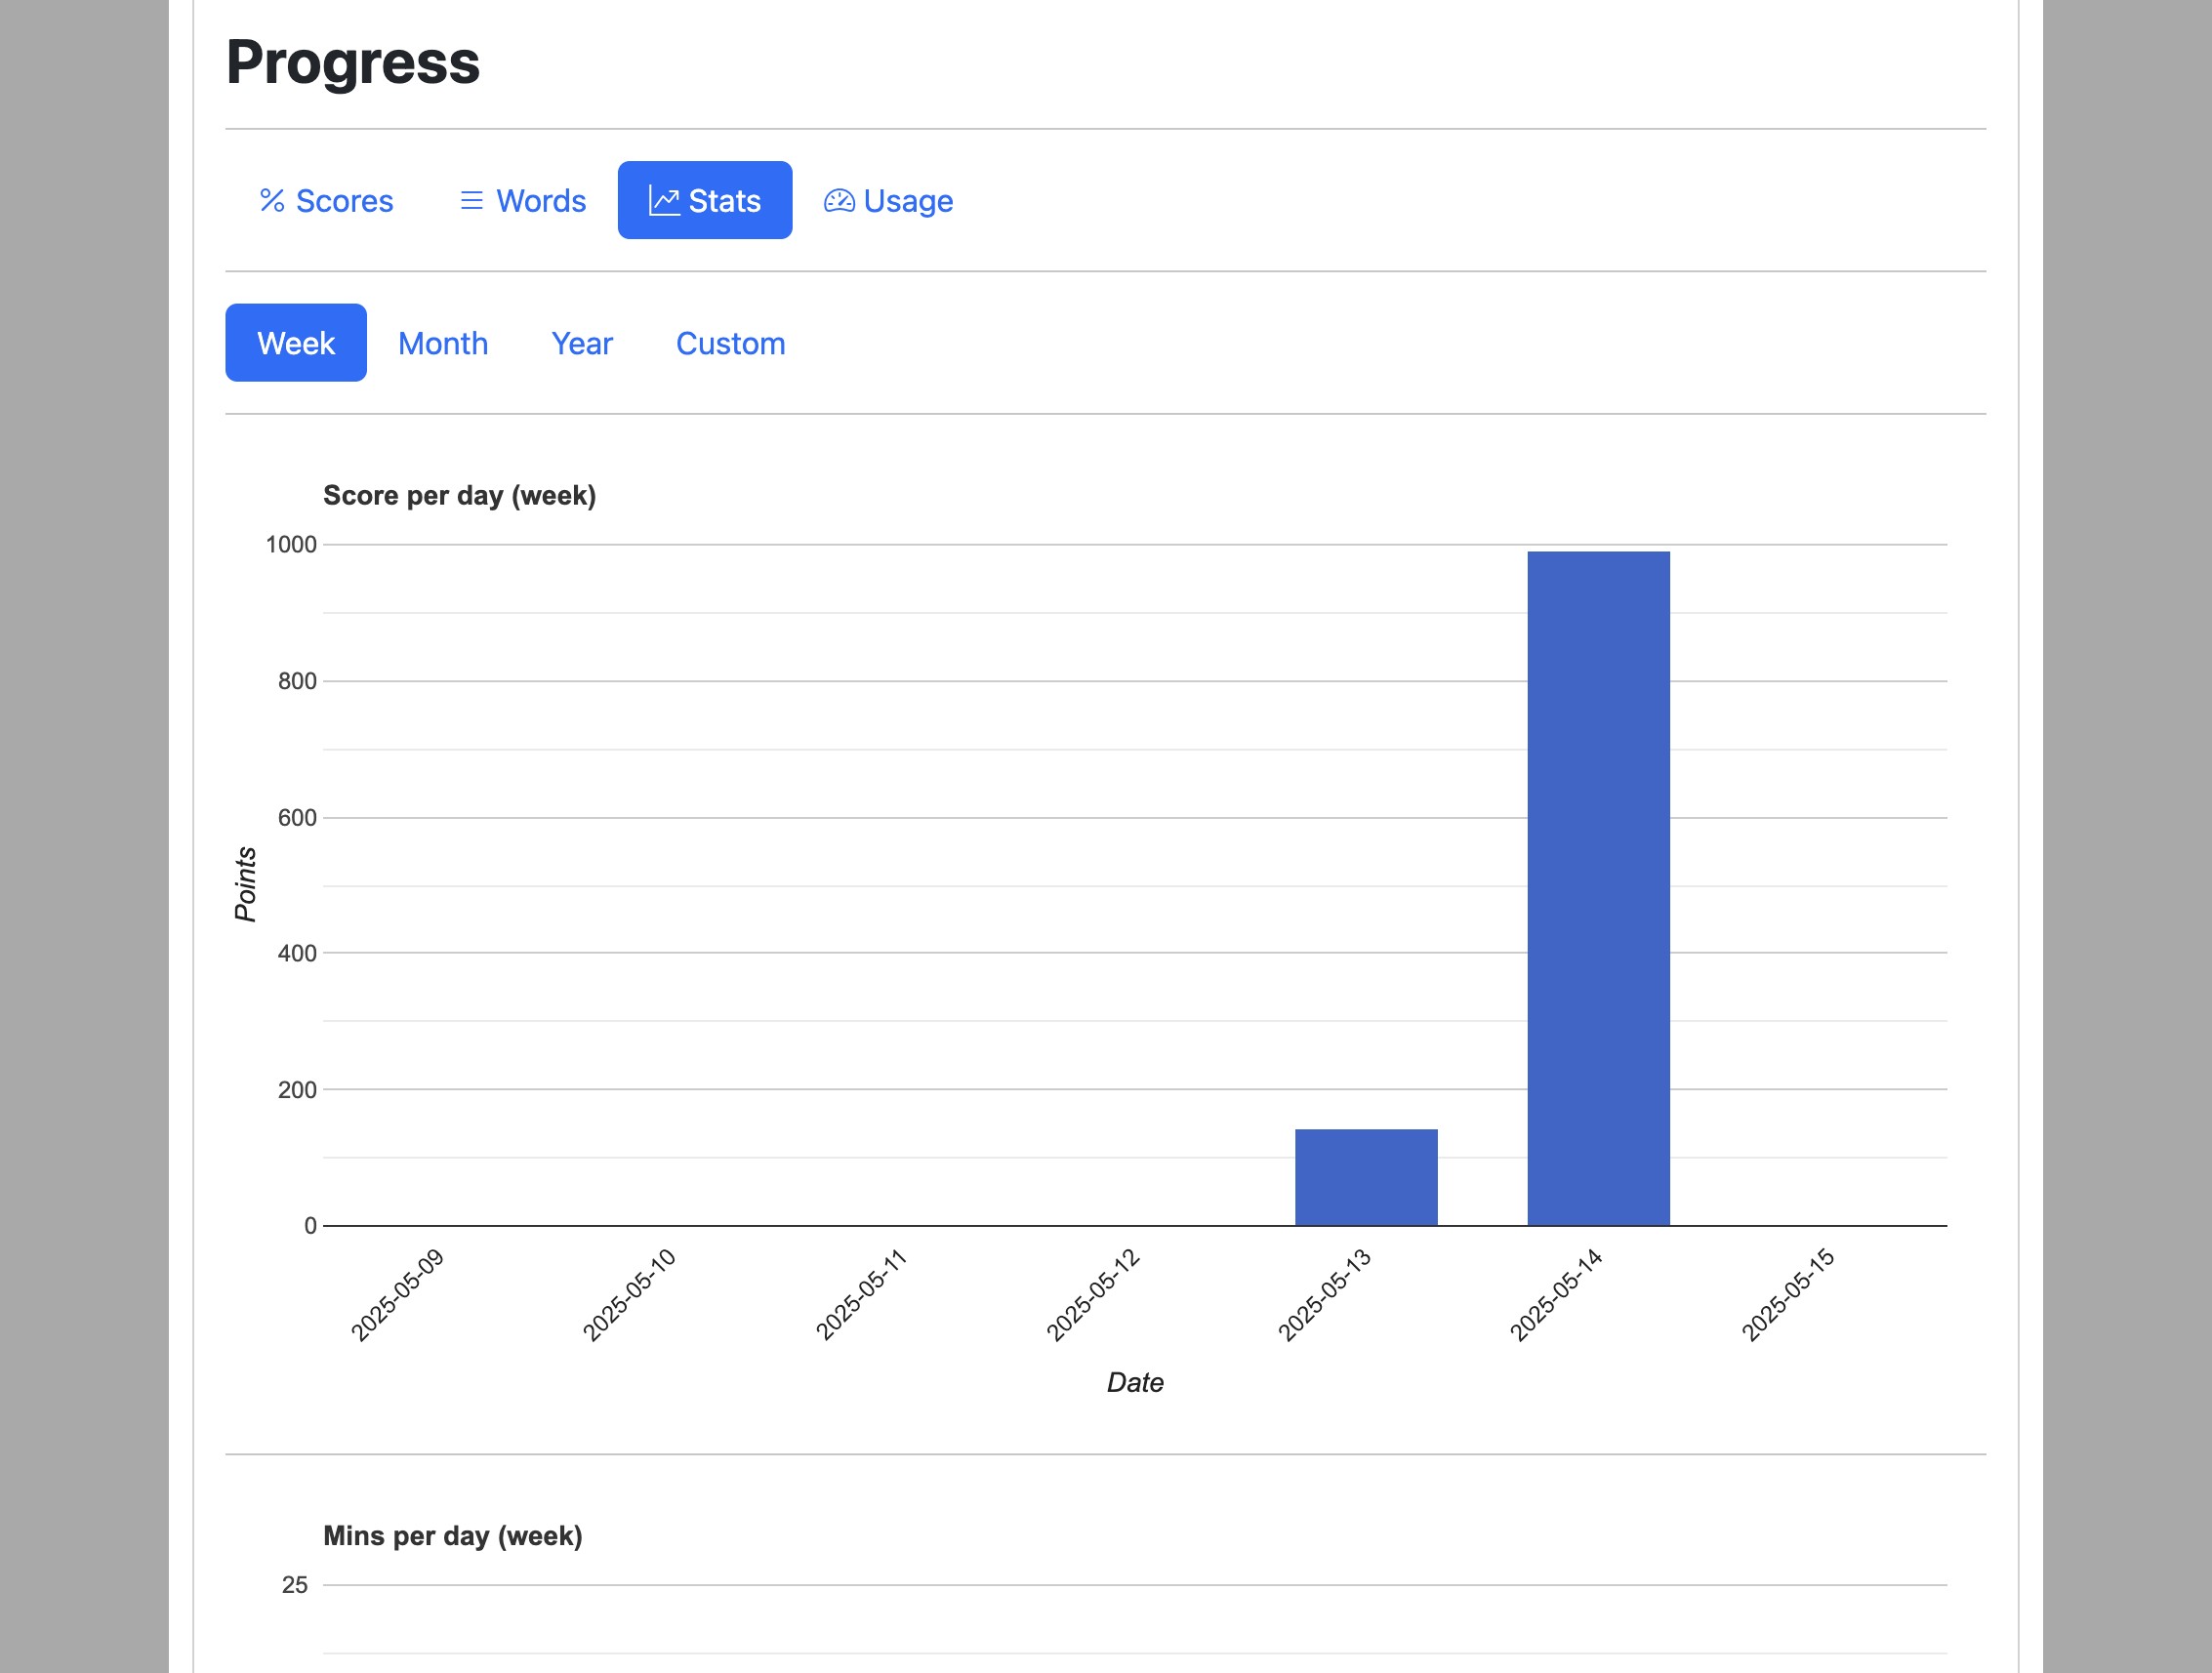
The "Mins per day" chart shows minutes spent on lessons per day, whether in a week, month, year or custom range.
7
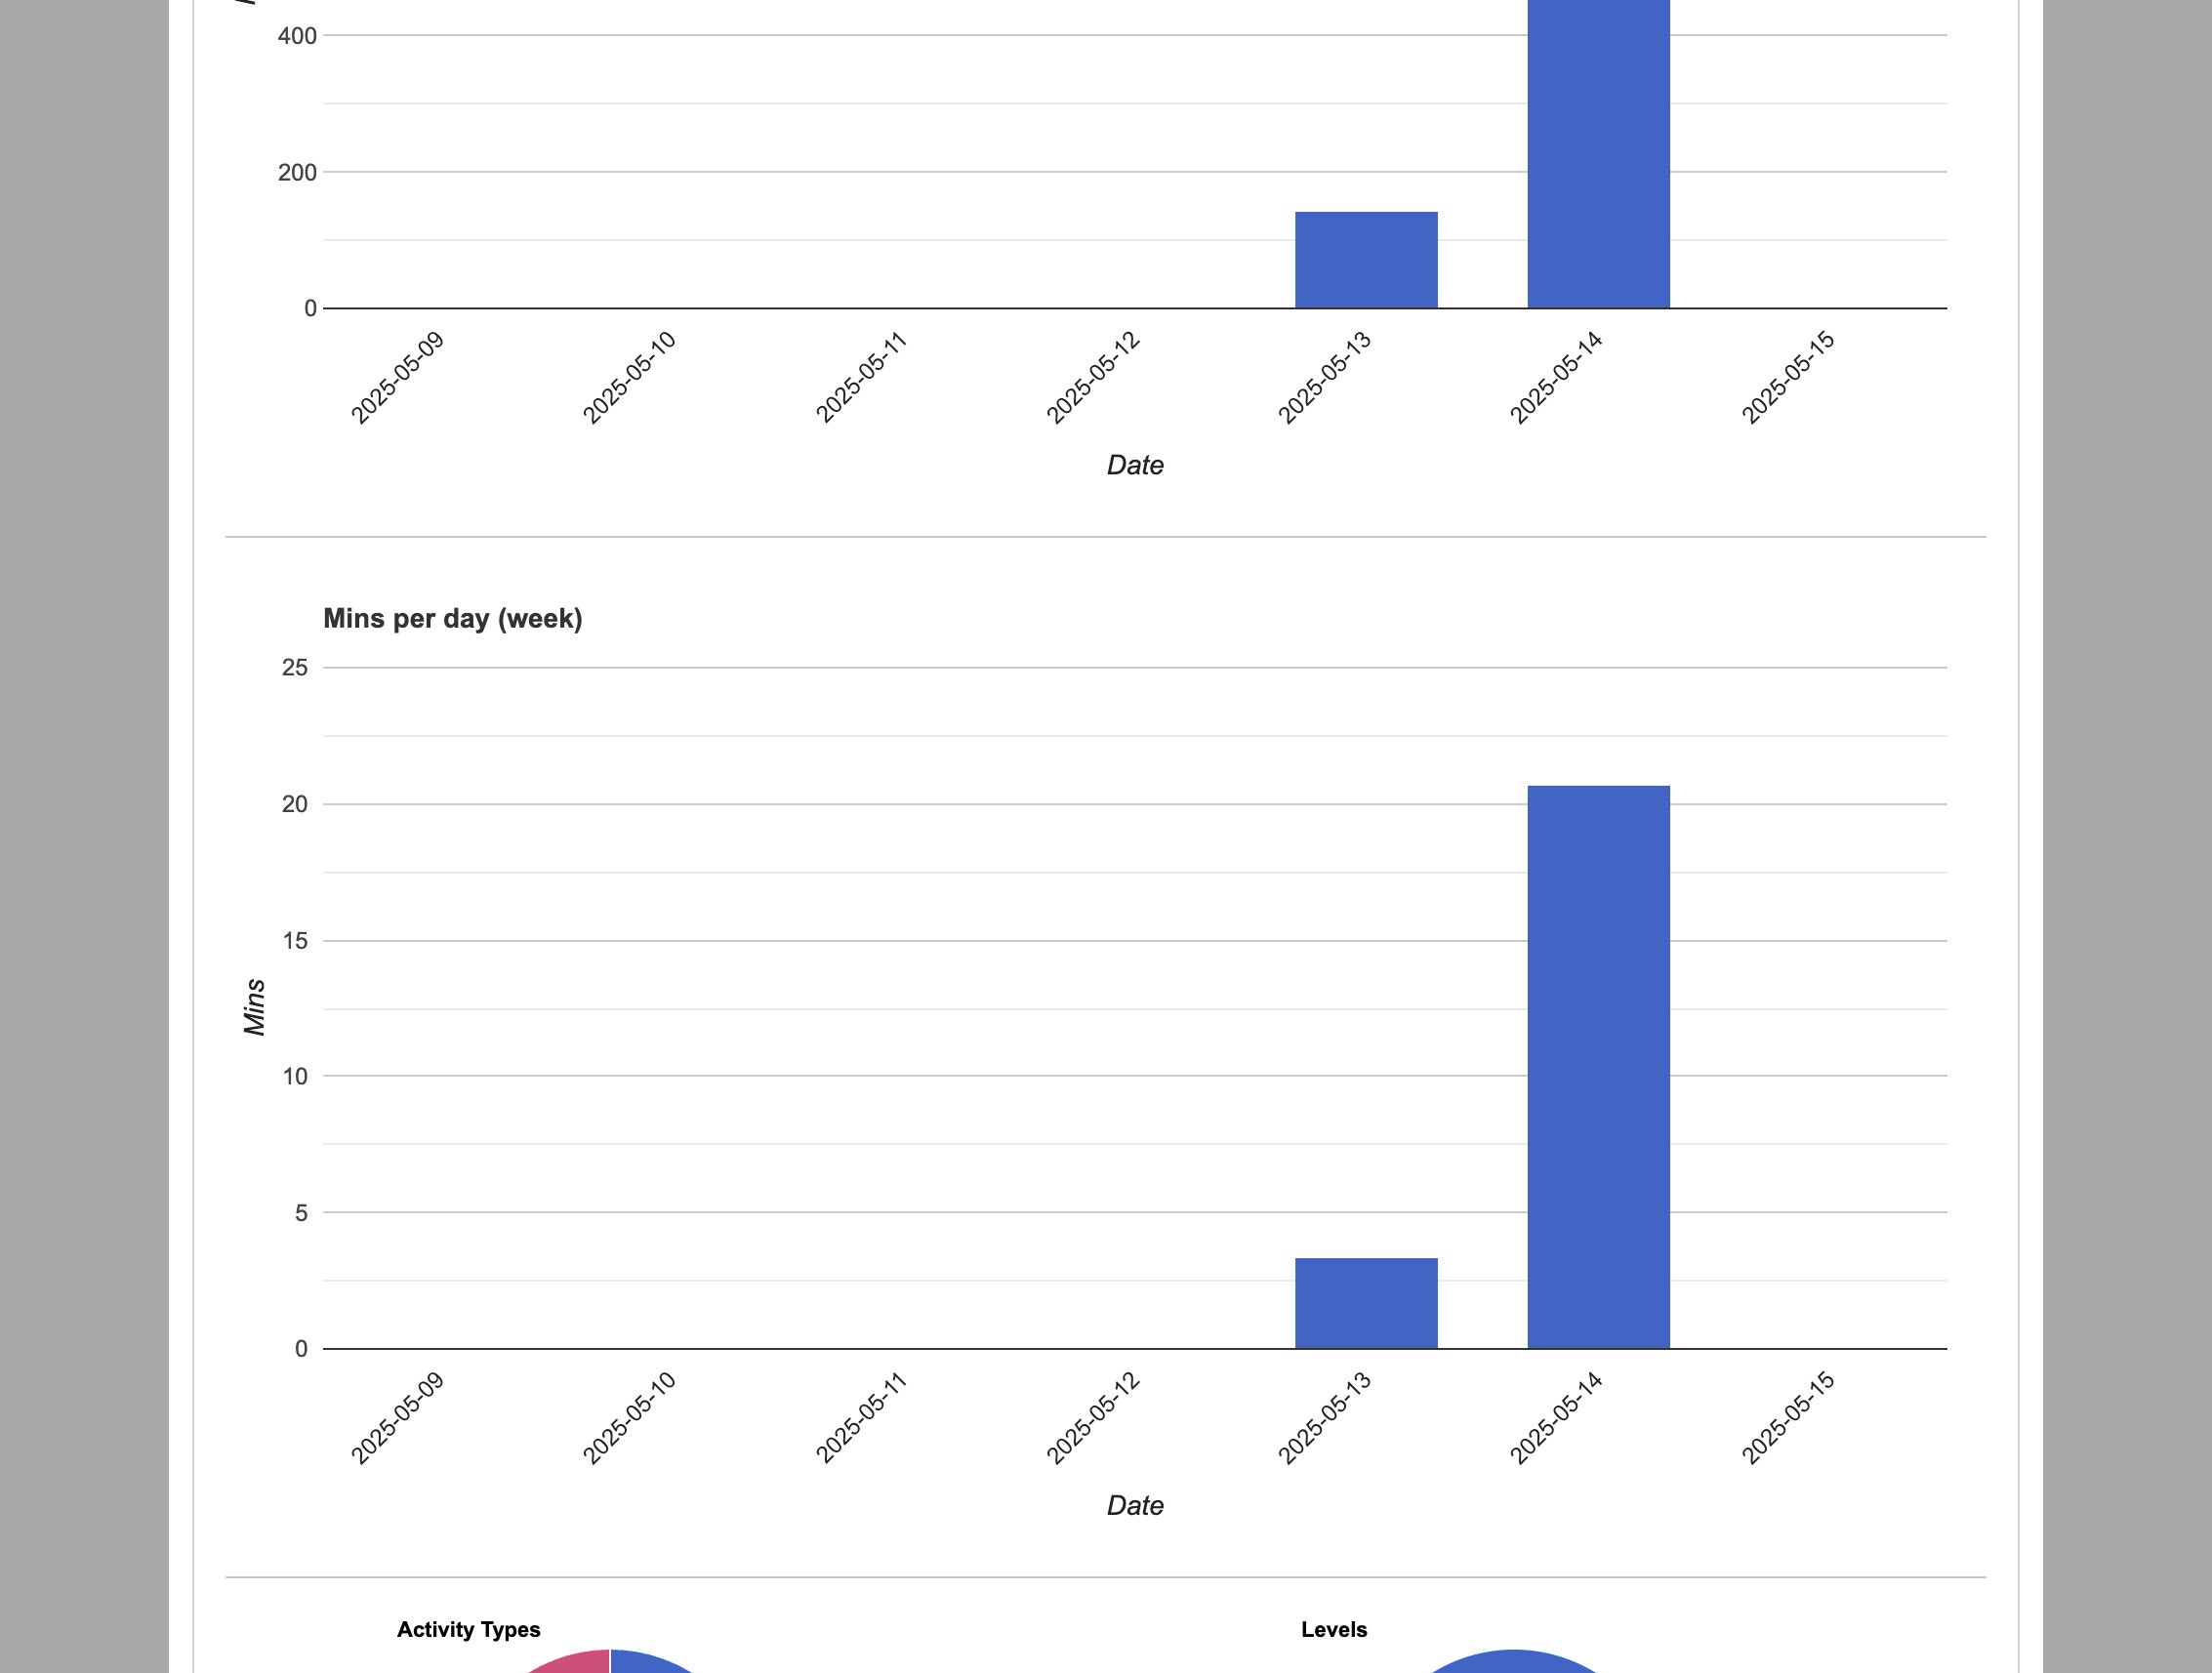
The "Activity Types" chart shows total times an activity type has been submitted.
8
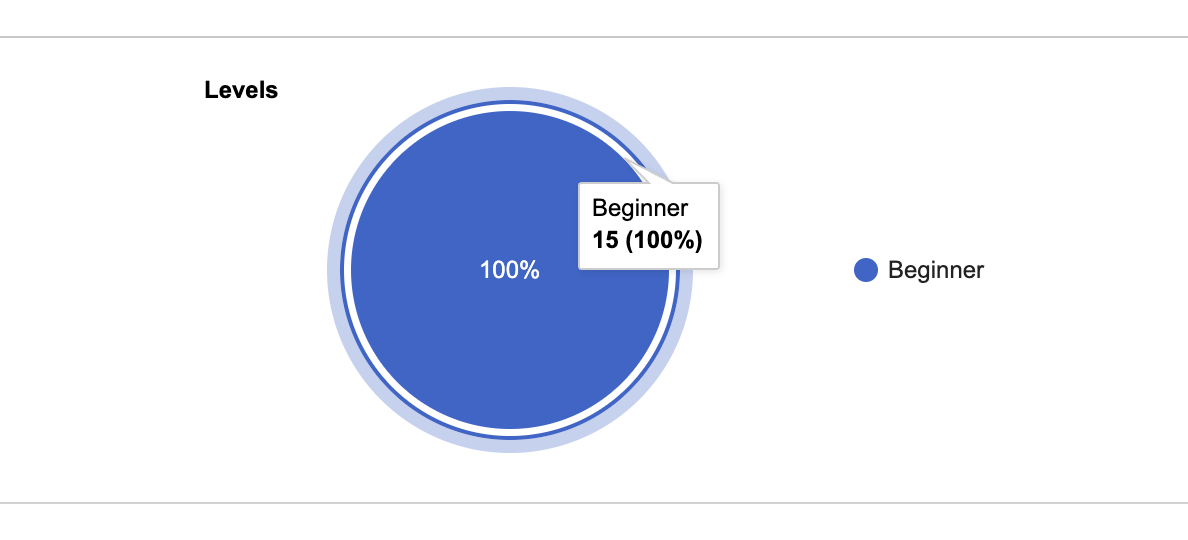
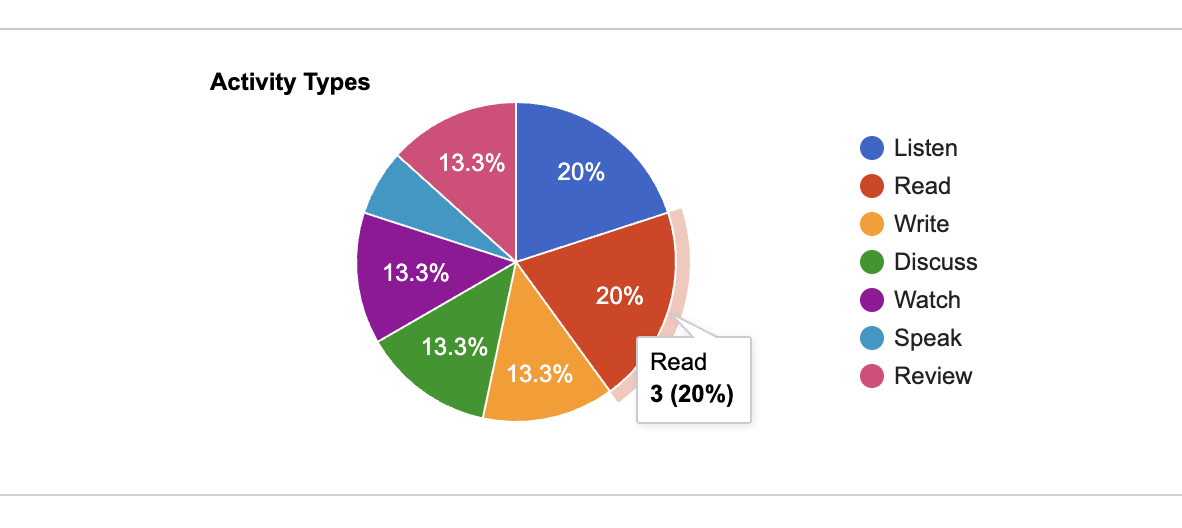
The "Levels" chart shows the total activities submitted per level.